Build Your Own Trading Tools: 7 Cool Things to Do with the TradeTally API

The TradeTally web app and mobile app cover the daily flow — log trades, review analytics, journal lessons. But the same data is sitting behind a public REST API, and once you have an API key the doors swing open.
This post walks through seven things I've seen people build (or want to build) on top of the API. Each example is a real, copy-pasteable starting point.
First, grab a key
In TradeTally, head to Settings → API Keys and create a key. You'll get something like tt_live_xxxxxxxxxxx. Treat it like a password — anyone with the key can read or write trades on your behalf.
Every request needs the key in a header. Either of these works:
curl -H "Authorization: Bearer tt_live_..." https://tradetally.io/api/trades
curl -H "X-API-Key: tt_live_..." https://tradetally.io/api/trades
Scopes determine what the key can do — trades:read, trades:write, analytics:read. Mint a read-only key for anything you don't fully trust (third-party dashboards, that script your friend wrote, etc).
Now the fun stuff.
1. A daily P&L digest in Slack or Discord
The fastest win. There's a /summary/quick endpoint that returns the numbers you actually want at the end of the day:
curl -H "Authorization: Bearer $TT_KEY" \
  https://tradetally.io/api/v1/trades/summary/quick
{
  "summary": {
    "totalTrades": 517,
    "openTrades": 29,
    "todayPnL": 0,
    "weekPnL": 0,
    "monthPnL": -133.25,
    "winRate": 68.03,
    "avgWin": 91.85,
    "avgLoss": -108.97
  }
}
Drop that into a cron job, format it, and POST to a Slack incoming webhook:
#!/bin/bash
SUMMARY=$(curl -s -H "Authorization: Bearer $TT_KEY" \
  https://tradetally.io/api/v1/trades/summary/quick | jq .summary)
TODAY=$(echo $SUMMARY | jq -r .todayPnL)
WIN_RATE=$(echo $SUMMARY | jq -r .winRate)

curl -X POST -H 'Content-type: application/json' \
  --data "{\"text\":\"📊 Today's P&L: \$$TODAY · Win rate: ${WIN_RATE}%\"}" \
  $SLACK_WEBHOOK_URL
Schedule it at market close and you get a daily reality check delivered to the same place you complain to your friends about your fills.
2. An iOS Shortcut for voice trade logging
This one's underrated. The Shortcuts app on iPhone can talk to any HTTPS endpoint with auth headers — meaning you can build "Hey Siri, log a long on AAPL at 175 with 100 shares" and have it actually create the trade.
Build a Shortcut that:
- Uses Dictate Text for the trade details (or accepts manual input).
- Parses the symbol, side, price, and quantity.
- Calls
POST /api/trades:
POST https://tradetally.io/api/trades
Authorization: Bearer tt_live_...
Content-Type: application/json

{
  "symbol": "AAPL",
  "side": "long",
  "entryTime": "2026-05-13T14:30:00.000Z",
  "entryPrice": 175.00,
  "quantity": 100
}
Hands-free trade logging while you're walking to lunch.
3. AI post-mortems with Claude or GPT
Once your trades are in TradeTally, feeding them to an LLM for review takes about 30 lines of code. Pull this week's closed trades, send them to Claude, and let it look for patterns you've been missing.
import anthropic, requests, os

trades = requests.get(
    "https://tradetally.io/api/trades",
    headers={"Authorization": f"Bearer {os.environ['TT_KEY']}"},
    params={"status": "closed", "limit": 50, "startDate": "2026-05-06"},
).json()["trades"]

client = anthropic.Anthropic()
review = client.messages.create(
    model="claude-opus-4-7",
    max_tokens=2000,
    messages=[{
        "role": "user",
        "content": f"""Review my trades from this past week. Look for repeat
        mistakes, time-of-day patterns, and setup quality issues. Be honest.

        Trades: {trades}"""
    }]
).content[0].text

print(review)
You can take this further: pipe the review back into TradeTally as a journal entry, or have the LLM tag every trade with the strategy it actually executed (versus what you claimed it was).
4. A custom analytics dashboard
The built-in analytics are good, but maybe you want a wall-mounted display in your trading room, or a Grafana board next to your other ops dashboards. The /api/v2/analytics/* family gives you everything you need:
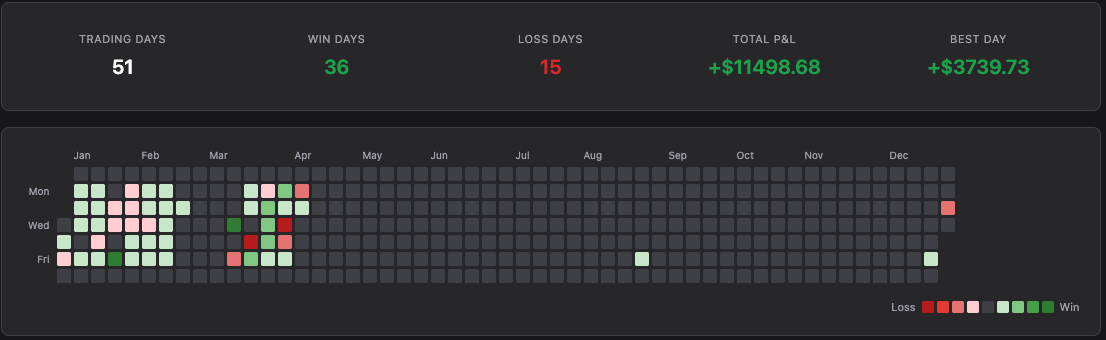
/api/v2/analytics/overview— totals, win rate, profit factor, streaks/api/v2/analytics/performance?period=daily|weekly|monthly— equity curve data/api/v2/analytics/calendar?year=2026— daily P&L for a heatmap/api/v2/analytics/symbols?limit=20— top instruments by activity/api/v2/analytics/charts— distribution, performance-by-price, hold-time buckets/api/v1/analytics/drawdown— max drawdown analysis
The calendar endpoint is especially fun — that's the raw data behind the GitHub-style heatmap. With about 50 lines of D3 or Plotly you can drop your own version into anything.
5. A risk watchdog for open positions
If you trade larger size, you've probably had the experience of forgetting about an open position. The API can babysit for you:
import requests, time, os

while True:
    res = requests.get(
        "https://tradetally.io/api/trades",
        headers={"Authorization": f"Bearer {os.environ['TT_KEY']}"},
        params={"status": "open", "limit": 100},
    ).json()

    for t in res["trades"]:
        # Trades older than X hours that are still open
        # Positions with unrealized loss past a threshold
        # Stops that are too far from entry
        if needs_attention(t):
            send_push_notification(t)

    time.sleep(60)
What "needs attention" means is up to you. A common one: alert if any open trade's unrealized P&L drops below -2 * avg_win.
6. Embed your P&L heatmap on your portfolio site
If you blog about trading, or run a Substack, or just want to flex a little on your personal site — the calendar endpoint returns the data, you render it however you want.
fetch(`https://tradetally.io/api/v2/analytics/calendar?year=${new Date().getFullYear()}`, {
  headers: { "Authorization": `Bearer ${TT_KEY}` }
})
.then(r => r.json())
.then(data => renderHeatmap(data));  // your D3 / cal-heatmap / etc.
Use a read-only key (analytics:read scope only) so you can safely ship it client-side. The heatmap looks great as a "what I actually did this year" anchor in an end-of-year writeup.
7. A leaderboard for your trading group
Got a Discord server full of traders comparing notes? Each member mints a read-only key, drops it into a simple bot, and now you have anonymous (or not) leaderboards: win rate, profit factor, biggest comeback week, longest green streak.
The shape is straightforward: collect keys, hit /api/v2/analytics/overview for each, rank, post weekly. You can add fun categories like "most disciplined" (highest % of trades with stops set) or "best Friday performance."
This works really well as accountability — nothing motivates you to fix your bad habits like knowing your average loss is going on a public scoreboard.
What's next
The full endpoint reference is in the API docs (Swagger UI in your TradeTally settings). A few things to know if you're getting serious:
- Idempotency: Bulk-create endpoints accept an
Idempotency-Keyheader so retries are safe. - Pagination: Use
?page=2&limit=50or?offset=50&limit=50— both work. - Versions:
/api/v1/*is the stable mobile surface./api/v2/*is deprecated — use legacy/api/trades/*and/api/v2/analytics/*for the cleanest path. - Rate limits: Be reasonable. The API has limits; if you're polling, cache responses for at least 30 seconds.
If you build something cool, tell me about it — happy to feature interesting integrations.